An Interview with the Met Council's Eric Wojchik
Record high temperatures are making headlines across the country this summer. According to the MN Department of Health, extreme heat events in Minnesota "are expected to become more common, more severe, and longer-lasting as our climate changes."
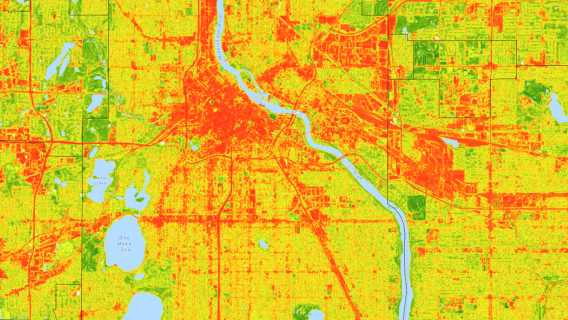
In spring 2023, a team of students in a Master of Urban and Regional Planning capstone course at the Humphrey School of Public Affairs worked on an RCP project about extreme heat, in partnership with Eric Wojchik and Ellen Esch at the Metropolitan Council. The resulting storymap, Keeping our Cool: Understanding extreme heat across the Twin Cities region, documents how excessive heat impacts public health and natural systems, as well as its equity and human health considerations. The project serves as a storytelling companion to the Council’s Extreme Heat Map Tool, which allows city planners and residents to explore the huge variance in surface temperatures in the Twin Cities metropolitan area.
RCP Program Coordinator Stina Kielsmeier-Cook recently interviewed Wojchik to learn about the impact of the extreme heat storymap project one year later. The interview has been edited for length and clarity.
Q: What was the value for you, as an employee of the Met Council, to have students engaged in qualitative research about extreme heat?
Eric Wojchik: Whenever you're doing qualitative research, there's so much legwork involved with logistics and scheduling, interviewing and transcribing. I know because we did a very similar qualitative project with Growing Shade, which is another interactive tool that we have, and it took a ton of staff time. We really didn't have the capacity to do this update or to create a new storymap to complement our Extreme Heat interactive tool, so having the students do research was amazing.
Also, sometimes the messenger is more important than the message, right? Many people are more responsive to students than they might be to Met Council staff for various reasons, be they political or otherwise. The students were able to get some amazing content just by going out there and being students. The people they interviewed wanted to support the students and provided a lot of good stories and commentary.
As a planner, I’m always trying to get people to think about the intersections of all these issues and how city development affects other things in our lives. I appreciate how the students approached extreme heat issues through different thematic lenses: an equity theme, a health theme, a climate change theme, and a natural systems theme. The students interviewed a public health professional and people involved in grassroots efforts around weatherization. They also spoke to experts on greening and natural systems, pollinator habitat, and urban farming. It made the issue much more holistic. The storymap paints a broad picture of what extreme heat means and how it manifests in different communities.
Q: What are some of the impacts of this project?
Eric Wojchik: For our 2050 planning cycle, which is going to kick off shortly, metro area communities will be updating their comprehensive plans, and I think the interactive storymap will have a major impact in that process. I see the storymap functioning as an entry point into the issue.
The interactive heat map is great for people that have been doing this for a while, but we really want communities that haven't thought about extreme heat to start thinking about it seriously. Planning has a significant role, and changing the built environment can reduce that heat impact. I don't think a lot of local governments have that on their radar. A tool like this can take on a life of its own, and can be implemented in different ways at the city level.
Q: What do you think people should know about the impact of different interventions by looking at the heat map?
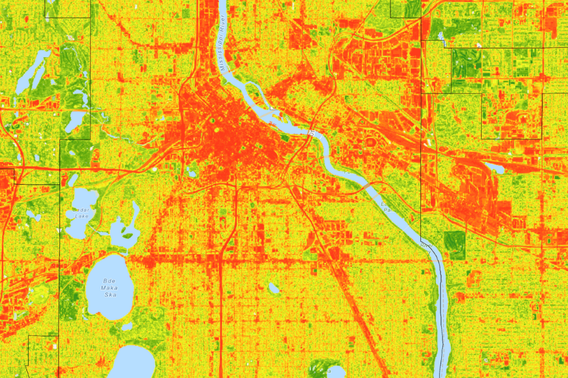
Eric Wojchik: Hot zones jump out in red on the heat map, and they’re concentrated along roads, commercial-industrial areas, and heavily built-up areas. But the green areas are just as important as the red ones. Green spaces and parks have a bleed out effect in terms of their cooling properties. Areas adjacent to parks are cooler, even if they are heavily built up. We started to understand the value of parks in a different way during the pandemic because we saw them as a place where we could gather safely and care for our mental health, but parks also function as a sort of cooling oasis. A lot of people don't have air conditioning, so access to green space is really important. Planners need to think about land uses and zoning more carefully in relation to green space. When we put multifamily residential in close proximity to parkland, families in those buildings can reap the cooling benefits of it.
Commercial-industrial areas are another opportunity. Landscaping requirements for most cities through zoning are really low for these areas. While people might not necessarily be living in those areas, they might be working there, dropping kids off at school, or shopping there. Could cities beef up landscaping requirements within retail commercial zones and other high heat areas? A lot of communities are thinking more about depaving underutilized parking lots. We should be asking how we can reduce heat in these areas, especially where you've got a lot of retail and a lot of commercial-industrial land.
We often think of the urban environment as fully built up, but we can do small things on private and public land to actually make a big difference. Planners often think we need a big, contiguous piece of land to enhance biodiversity. That's fair. But we can also do things on the boulevard level. Consider removing requirements around turf grass and allow people to plant and maintain pollinator habitat or prairie habitat within their lawns. That can make a massive difference, especially if you think of how that gets stitched together on a macro scale. And small interventions can make people's immediate neighborhood experience so much better.
Q: How do you hope that city planners use the storymap tool?
Eric Wojchik: We want people to have multiple entry points to extreme heat issues. Anyone who works in climate knows that we've been bad at framing these issues. We've been science heavy, very focused on graphs, and the qualitative components have been totally missed. Storytelling brings the issue to life in a way that resonates with Minnesotans and makes it feel very immediate. They can say, “Oh, I've experienced that. That is a really hot neighborhood or parking lot, especially when it's 97 degrees. There are no trees.”
Expanding local understanding of extreme heat is helpful for climate action. It’s not just about polar bears. It's an issue for Minnesota, and I want communities to know that they have agency. Tools like this storymap are good at bringing people into the issue and can help them get the buy-in from decision makers to create new policies and local ordinances that can make a difference. I want there to come a time when climate planning is just planning. We should be thinking in 30-year horizons.
Q: The Met Council is investing matching funds for local government entities to participate in an RCP project. What pitch would you make to a busy government staff member about the value of applying to RCP?
Eric Wojchik: When I was going through 2040 comprehensive plans, I saw all these great commitments that cities had made, but a lot didn't have capacity to carry them out. Cities can bring those great lists of aspirational commitments to RCP, and graduate students can perform a study or do some foundational research to help an idea get implemented. Quite often it’s the initial work that's hard for cities because they don’t have the extra staff time. Once the RCP reports are completed, the city can advocate for funds based on the demonstrated need. It really gets things moving. And when residents see the benefits of what the city has done, they want more delivery on those commitments.
The applied side for the students is also great. Students can see how their work is useful on the ground, and they can point to these projects when they're in a job interview. Students who are just starting out can get a leg up on their careers. I appreciate that.